
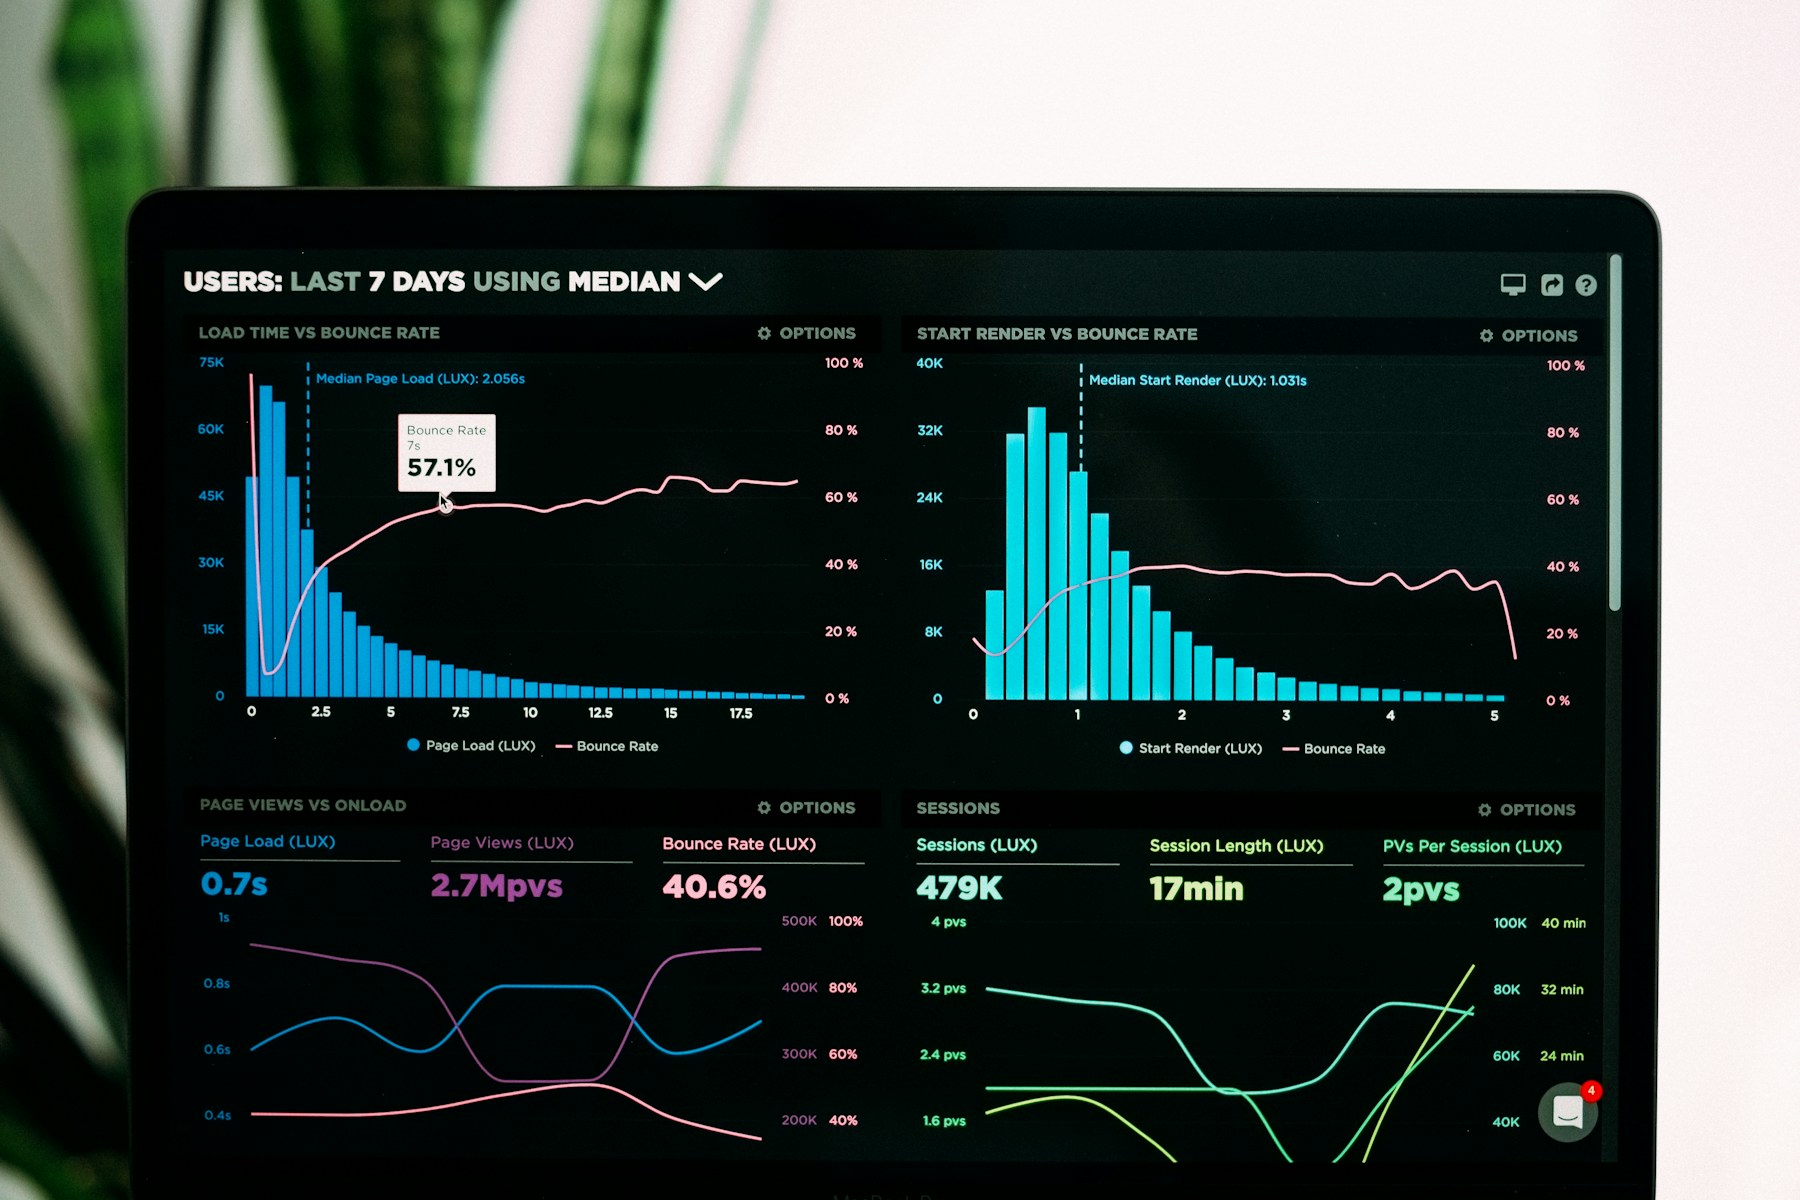
Power BI and Tableau can both produce capable dashboards. The better choice depends less on a feature checklist and more on the environment in which the platform must work.
Start with four questions.
1. What does your team already use?
Power BI often fits naturally when Microsoft 365, Excel, Azure, and Fabric are already part of daily work. Identity, sharing, and data connections may be easier to manage within that ecosystem.
Tableau can be a strong fit for teams that value flexible visual exploration, have analysts who work across varied data sources, or already use Salesforce products.
The existing stack does not decide the answer, but it changes the cost of adoption.
2. Who will build and maintain the dashboards?
A dashboard is not finished when it launches. Data sources change, definitions drift, and new questions arrive.
If business users will maintain straightforward reporting, Power BI’s relationship with Excel can reduce the learning curve. If a specialist analytics team will create exploratory views for varied audiences, Tableau’s visual workflow may be valuable.
Choose for the team that will own the system six months after launch.
3. How complex is the data model?
Do not compare visual polish before understanding the model underneath it. List the data sources, refresh frequency, row volumes, calculations, security rules, and expected user count.
Complex models can work in either platform, but they need sound architecture. A poor semantic model will produce a slow and unreliable dashboard regardless of the tool.
4. What decision will the dashboard support?
Executive performance reporting, sales operations, marketing attribution, and exploratory analysis have different needs. Define the recurring decision first, then test each platform against a small representative use case.
Run a short proof of concept
Build the same critical view in both tools using real data. Compare:
- Time to connect and clean the data
- Time to build the measures
- Page performance
- Publishing and access control
- Ease of making a common change
- Total licensing and maintenance cost
The winning platform is the one your organisation can operate reliably, not the one with the longest feature list.